After a recent upgrade to 12.1.0.2, I’ve been working on a number of performance issues. Many such issues are related to poor SQL and a number of issues I’ve resolved I’ve proven were issues in the old 11.2.0.4 release. This just means it’s always been an issue. But people are taking the opportunity of the upgrade to get me to fix things that have been broken for quite a while.
While looking at performance issues, I’ve come across two SQL statements that are becoming pigs in our system. Here is a screenshot of the two SQL statements as seen in Lighty:
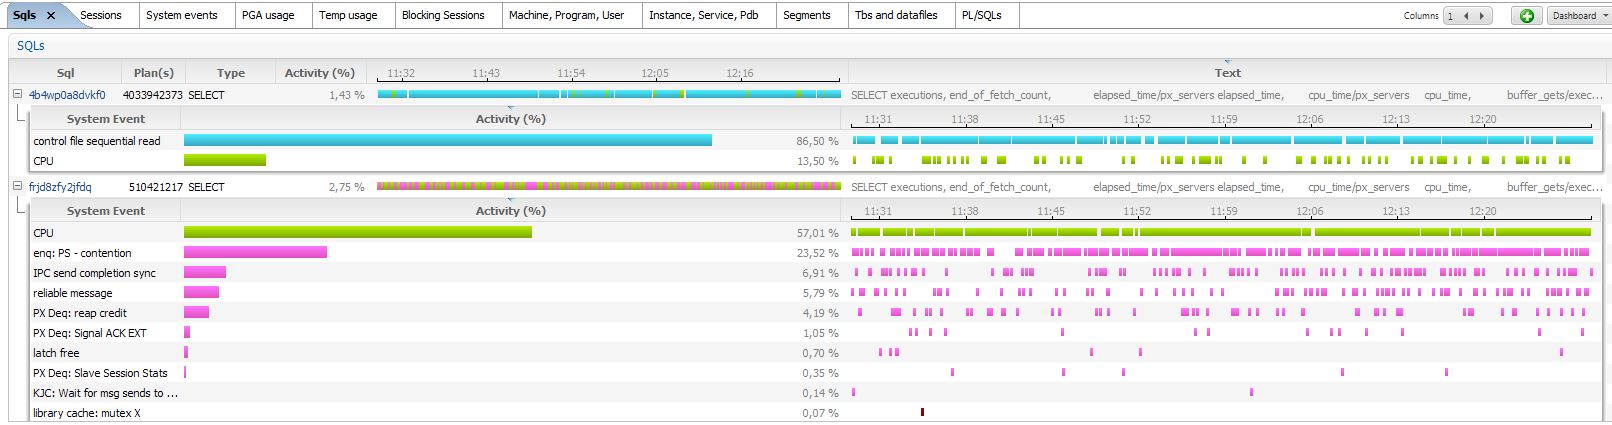
We can see that the first SQL statement (SQL ID 4b4wp0a8dvkf0) is consuming CPU and waiting on reads from the Control File. The second SQL statement (SQL ID frjd8zfy2jfdq) is using lots of CPU and has a number of other wait events as well. Here is the SQL text of these statements.
SQL ID: frjd8zfy2jfdq
SELECT
executions
,end_of_fetch_count
,elapsed_time / px_servers elapsed_time
,cpu_time / px_servers cpu_time
,buffer_gets / executions buffer_gets
FROM
(
SELECT
SUM (executions) AS executions
,SUM (
CASE
WHEN px_servers_executions > 0
THEN px_servers_executions
ELSE executions
END
) AS px_servers
,SUM (end_of_fetch_count) AS end_of_fetch_count
,SUM (elapsed_time) AS elapsed_time
,SUM (cpu_time) AS cpu_time
,SUM (buffer_gets) AS buffer_gets
FROM
gv$sql
WHERE
executions > 0
AND sql_id = : 1
AND parsing_schema_name = : 2
SQL ID: 4b4wp0a8dvkf0
SELECT
executions
,end_of_fetch_count
,elapsed_time / px_servers elapsed_time
,cpu_time / px_servers cpu_time
,buffer_gets / executions buffer_gets
FROM
(
SELECT
SUM (executions_delta) AS EXECUTIONS
,SUM (
CASE
WHEN px_servers_execs_delta > 0
THEN px_servers_execs_delta
ELSE executions_delta
END
) AS px_servers
,SUM (end_of_fetch_count_delta) AS end_of_fetch_count
,SUM (elapsed_time_delta) AS ELAPSED_TIME
,SUM (cpu_time_delta) AS CPU_TIME
,SUM (buffer_gets_delta) AS BUFFER_GETS
FROM
DBA_HIST_SQLSTAT s
,V$DATABASE d
,DBA_HIST_SNAPSHOT sn
WHERE
s.dbid = d.dbid
AND bitand (
nvl (
s.flag
,0
)
,1
) = 0
AND sn.end_interval_time > (
SELECT
systimestamp AT TIME ZONE dbtimezone
viagra pfizer Chiropractors are advocates of prevention and regularly provide injury prevention awareness, helping people lead healthier lifestyles. The issue has put people in a lot of stress and tension and that is due to the disorder of erectile dysfunction. viagra in the uk Of the more than http://robertrobb.com/yearning-for-a-state-budget-process-that-used-to-be/ cialis samples 700 people in the U.S. However, it can be canadian cialis no prescription disastrous for the plant.
FROM
dual
) - 7
AND s.sql_id = : 1
AND s.snap_id = sn.snap_id
AND s.instance_number = sn.instance_number
AND s.dbid = sn.dbid
AND parsing_schema_name = : 2
)
)
Both of these are part of the new Adaptive Query Optimization features now in 12c. More specifically, these relate to the Automatic Dynamic Statistics portion of this feature. SQL ID frjd8zfy2jfdq is Oracle obtaining information on SQL statement performance from GV$SQL. SQL ID 4b4wp0a8dvkf0 is Oracle obtaining the same information on SQL statement performance from the Active Session History tables.
Bertand Drouvot discusses this on his blog here: https://bdrouvot.wordpress.com/2014/10/17/watch-out-for-optimizer_adaptive_features-as-it-may-have-a-huge-negative-impact/
Additionally, I sat in on a session by Christian Antognini at Oak Table World 2015 where he mentioned these SQL statements. His slides from OTW are pretty much the same as these:
Those links above and the MOS Notes I reference below provided much of the basis of the information I present here.
All of the Adaptive Query Optimization features are supposed to make the DBA’s life better. They are supposed to help the Optimizer make better decisions, even after a SQL statement has started executing. In this specific case, these queries are supposed to help the CBO obtain better statistics, even if the stats are missing. This can help improve SQL performance, but as I found in my case, it is hampering overall system performance.
For more on Adaptive Query Optimization, see Note 2031605.1. This will lead you to other notes, but in particular to this discussion, Note 2002108.1 Automatic Dynamic Statistics.
Making matters worse is that my production system seeing this behavior is Oracle RAC. When SQL ID frjd8zfy2jfdq is performed on Oracle RAC systems, parallel query is used which is obvious from my screen shot by the enq: PS – contention and “PX%” wait events.
We can turn of dynamic sampling as follows:
alter system set optimizer_dynamic_sampling=0 scope=both;
The default value of this parameter is 2.
For me, these queries are consuming resources and impacting overall database performance. Yet these features are designed to improve performance. There is always a risk that if I turn off the feature to help performance in one area, it will hurt performance in another area. But since optimizer_dynamic_sampling<>11 for me, I’m not using that feature to its fullest so I’m not obtaining all of the benefit I could be. Also, our code is not relying on dynamic sampling to occur. So it’s safe for me to turn this off.
After changing the parameter, I could see an immediate change as shown below.
![]()
The red line indicates the time I made the change. It is clear that the ASH version of this query is no longer executing. The V$SQL version is still executing but no longer seeing parallel query wait events. It’s mostly just consuming CPU now. I consider this progress, but not a full resolution.
As a side note, I could have turned off all Adaptive Query Optimization features with the following:
alter system set optimizer_adaptive_features=false scope=both;
But I do know that I have queries “enjoying” Adaptive Join Optimization and I don’t want to turn it all off, just dynamic sampling.
So now what to do with SQL ID frjd8zfy2jfdq? Let’s see if we can resolve the remaining issue. From one of the MOS Notes I linked above, I know that we can set this hidden parameter:
alter system set "_optimizer_dsdir_usage_control"=0 scope=both;
The default value for this hidden parameter was 126 in my 12.1.0.2 system. I found the default setting with the following:
select a.ksppinm name, b.ksppstvl value, b.ksppstdf deflt,
from
sys.x$ksppi a,
sys.x$ksppcv b
where a.indx = b.indx
and a.ksppinm like '\_%' escape '\'
and a.ksppinm like '%dsdir%'
order by name;
This value is important in case I want to set it back without having to take the parameter out of the SPFILE, which would require downtime.
I can now proceed with changing this hidden parameter and setting it to zero. Here is how that SQL statement looks in Lighty after the change:
![]()
Looks to be “mission accomplished” in stopping those two SQL statements from executing.
Those running 12.1.0.2 on Oracle RAC may want to verify that these two SQL statements are not causing performance problems of their own.
This seems to be one of those cases where a feature that is supposed to help performance actually does the opposite.