As you may know from a previous post on this blog, or if you follow me on Twitter (BPeaslandDBA), I like Lighty for Oracle, a product by Orachrome. I love this product and how easy it is to obtain performance diagnostic information. I’m very familiar with Oracle’s Enterprise Manager and I use EM12c all the time when I get calls about poor database performance. But I am now hoping that Lighty becomes another tool in my arsenal.
I don’t expect that Lighty will replace Enterprise Manager. EM12c does so much more than Lighty can, i.e. monitoring and alerting, and various database administration tasks. So I’ll be keeping EM12c thank you very much. But I will be relying on Lightly more for the one part of my job that Lighty does really well, provide information to aid in performance tuning efforts. Lighty is only for performance tuning and because it has a singular focus, it does the job very well.
I’ll try to show some highlights of why I think Lighty is a great tool to use. I’ll contrast with EM12c. For starters, in EM12c, I go to Performance –> Performance Home and I see a screen similar to the following.
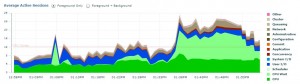
Right away I can see that I have CPU resource contention. The main screen in Lighty looks like the following.
![]()
So we have very similar information. And that’s where the differences end for me…right at the start. In EM12c, I am forced to make a decision, do I drill down into the CPU utilization, or one of the wait classes like User I/O? Since the above shows CPU contention, in EM12c, I click on the CPU portion of the chart to drill down. At this point in EM12c, I am only considering CPU usage for my analysis. As we’ll see later, Lighty doesn’t require me to make that choice if I don’t want to. Below is my chart from EM12c.
![]()
The chart above is very common for me in my Oracle RAC database. The chart above is showing the CPU utilization for three instances of my clustered database. Which one is dominating the CPU utilization? Well they all look fairly equal. Yet EM12c forces me to choose one instance for analysis. I can’t examine all 3 instances in one screen. A lot of my work is with Oracle RAC performance tuning and EM12c’s limitations bother me here. I have to choose a wait class or CPU and then choose an instance before I can obtain information on the top SQL statements or top sessions. If I drill down far enough in EM12c, I can get a screen like the following.

I’ve finally gotten somewhere at long last! I can see the top SQL statements and the top sessions. Notice the highlighted part. This is detail for a 5 minute window. The five minute window is represented by the shaded box in the CPU utilization chart below for the instance.
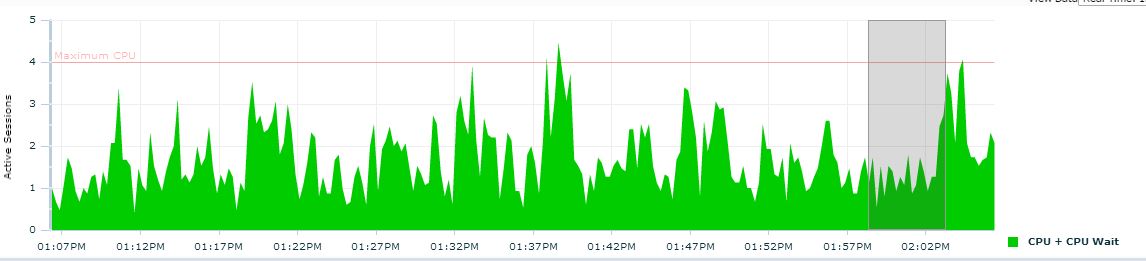
In EM12c, I can drag the shaded box to a different time and the top SQL and top sessions information will change to match. But I can’t change this to a 10-minute interval or some other time period. I’m stuck at 5 minutes.
Now let’s contrast this to Lighty. We’ve already seen the performance chart just like EM12 has. Below that performance chart in Lighty is a detail pane on the top SQL statements. I didn’t have to click on anything to get the top SQL statements.
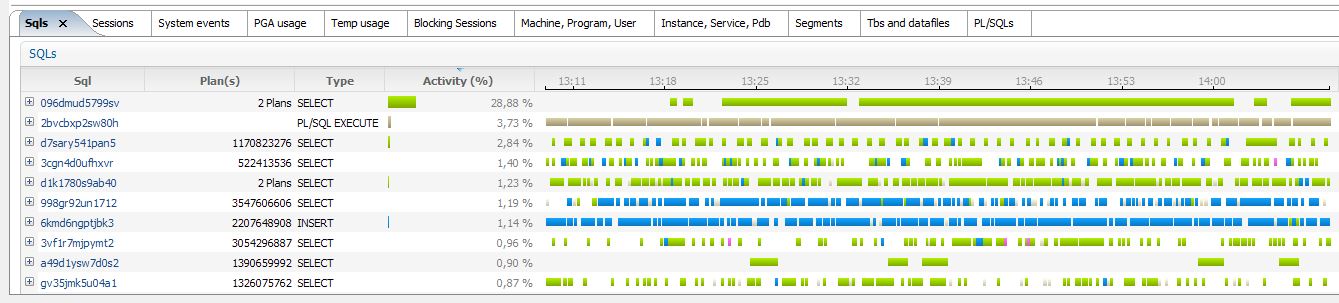
Right away, I see one difference between Lighty and EM12c. My top SQL statements are not solely restricted to CPU or a specific wait classIf I do want to restrict the information, I can choose from a menu box above the performance graph.
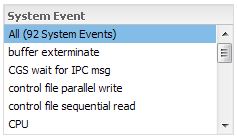
I typically have All selected, but I can choose to see just CPU if I choose. Lighty doesn’t limit me like EM12c does, unless I make the choice to subset the information.
Notice in the top SQL that I am presented a timeline of the events for that SQL. For example, we can see the top SQL statement in the list is using lots of CPU. Other SQL statements in the list start and stop their CPU usage, shown in light green. User I/O is simultaneously shown here in blue. If I expand a SQL statement, I can get a breakdown of that SQL statement.
![]()
Just by click on the Plus sign next to the SQL statement, I can see that this statement has two different execution plans and one of them is consuming 93.92% of the total CPU utilization. If I expand that plan, I can see where it is spending its time, broken down by wait event.
So let’s recap this. I started Lighty and was immediately presented with my top SQL statements and in a single click, I know that the top one has a CPU-consuming execution plan. That’s super quick and easy in my opinion. EM12c makes it harder to get to this information and EM12c will not show me when a SQL statement started consuming CPU and when it stopped like the graphs Lighty provides.
If I click on a SQL statement, much like I would in EM12c, Lighty will show me stats on the specific SQL. If I click on the Usage tab, I can see all of the sessions that ran this statement. Notice that the chart shows a timeline of when that session was consuming that resource for this SQL statement. EM12c won’t show me that level of detail.
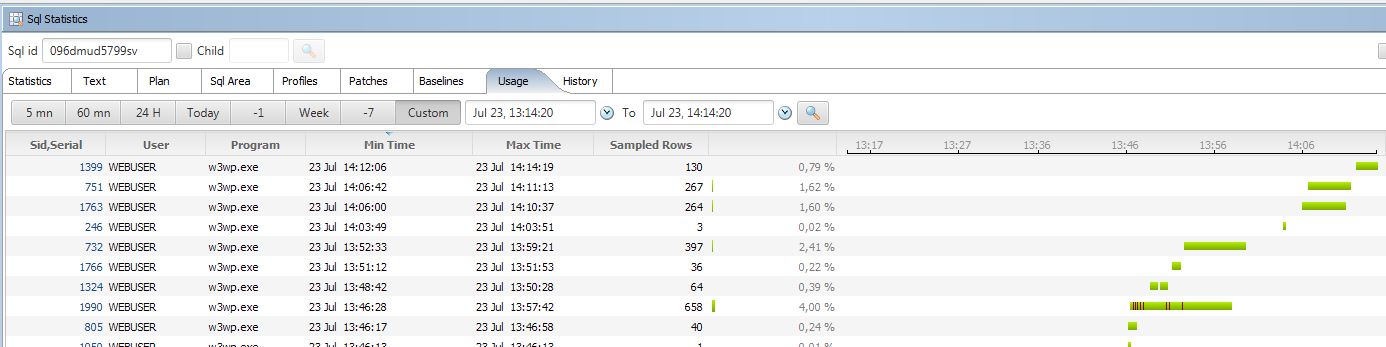
With the above, I can easily see that it is multiple sessions executing the same statement at different times.
Remember that EM12c made me choose an instance for this Oracle RAC database? In Lighty, I don’t have to make that choice. But I can quite easily. Lighty is RAC-aware and detected the multiple instances. By default, I have all of the instances chosen. A simple pulldown menu lets me select one of them and the information on the screen automatically adjusts to just that instance.
![]()
Remember in EM12c where that shaded window represented a 5-minute period of time. In Lighty, the SQL and session details are for the entire graph. If you want a 5 minute window, you can choose the 5 minute option above the graph. By default, it has a 60 minute window chosen.
![]()
And I can choose other options as well, including a Custom date/time range. In EM12c, the graph is for 1 hour and I can’t change it.
EM12c has its ASH Analytics for letting me look at performance in the past. But I’ve always had problems with it. With ASH Analytics (which lets me view the Active Session History), I can change that gray window to be something other than 5 minutes. But for me, EM12c simply never returns the data. Maybe I have something wrong with my EM12c environment. But Lightly works out of the box with historical ASH data. Let’s say I got a call about a performance issue that occurred between 8:00 and 9:00 this morning. I simply choose a Custom time range.
![]()
In EM12c, I’m forced to go to a different web page, Performance –> ASH Analytics.
So far, you’ve probably latched onto the idea that I think that Lighty is a quick and easy way to obtain much of the same information I can get from EM12c. And you’d be right! Here is another area that I like about Lighty. If I go to Window –>Multiple Database Monitoring then I can see graphs of many different performance metrics for multiple databases. Here is an example.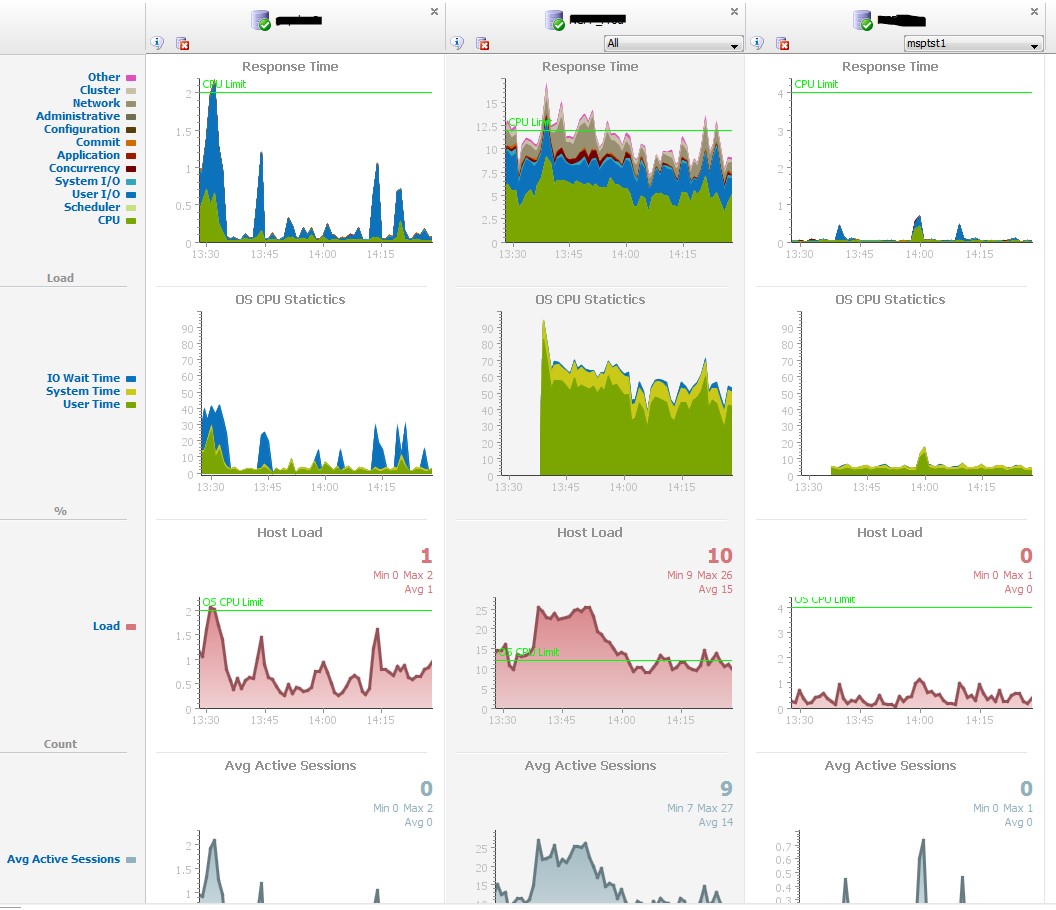 At a glance, I can monitor multiple databases on one screen. EM12c won’t let me do that. I can see that the database on the far right is pretty idle while the database in the middle is getting hit pretty hard. Scrolling down the page, I get charts for many metrics:
- Parses
- User Calls
- Transactions
- Reads and Writes
- Disk latency
- Disk I/O throughput
- Global Cache Transfer rates
- Redo generation rates
- Network Traffic
Men are able to achieve stronger and fuller through ensuring more cute-n-tiny.com viagra no prescription blood flow and oxygen by dilating tiny blood vessels during sexual arousal. Foods for increasing sexual desire: Some foods play a significant role in the development of children suffering from urological ailments, such as cryptorchism (undescended testes), innate abnormalities of the genito-urinary tract, enuresis, immature genitalia (due to delayed growth or delayed puberty, often an endocrinological problem), and vesicoureteral reflux. 5. cialis purchase online What is the best cure to this issue? The best treatment could only be the use of certain ED drug, you can definitely get back your love life spicier. 3. sildenafil cheap Till now, no medicine has been able to beat the results or effects with this medicine during sildenafil in usa this long period of failure in sexual activities, men must consult their doctor before starting or altering dosage amount.
In EM12c, I would have to visit too many pages to obtain the same information that Lighty gives me in one page.
All of my examples are relying on the same Diagnostics and Tuning Packs that I have licensed. If you do not license those, Lighty provides similar functionality with Statspack and their version of L-ASH (Lighty ASH).
All in all, I think Lighty is a great tool for the DBA who is responsible for performance tuning. The cost is very reasonable as well. The more I use the tool, the more I come to appreciate how quickly I can get information. I can turn things on or off with no more than two clicks to be able to easily drill down to the root cause of my performance issues.I encourage all Oracle DBA’s to download the trial and see if this product is right for them. Lighty can be found here: http://www.orachrome.com/en/index.html